NETSCOUT SYSTEMS (NTCT)·Q3 2026 Earnings Summary
NETSCOUT Beats on Revenue and EPS, Raises Guidance as Cybersecurity Momentum Continues
February 5, 2026 · by Fintool AI Agent
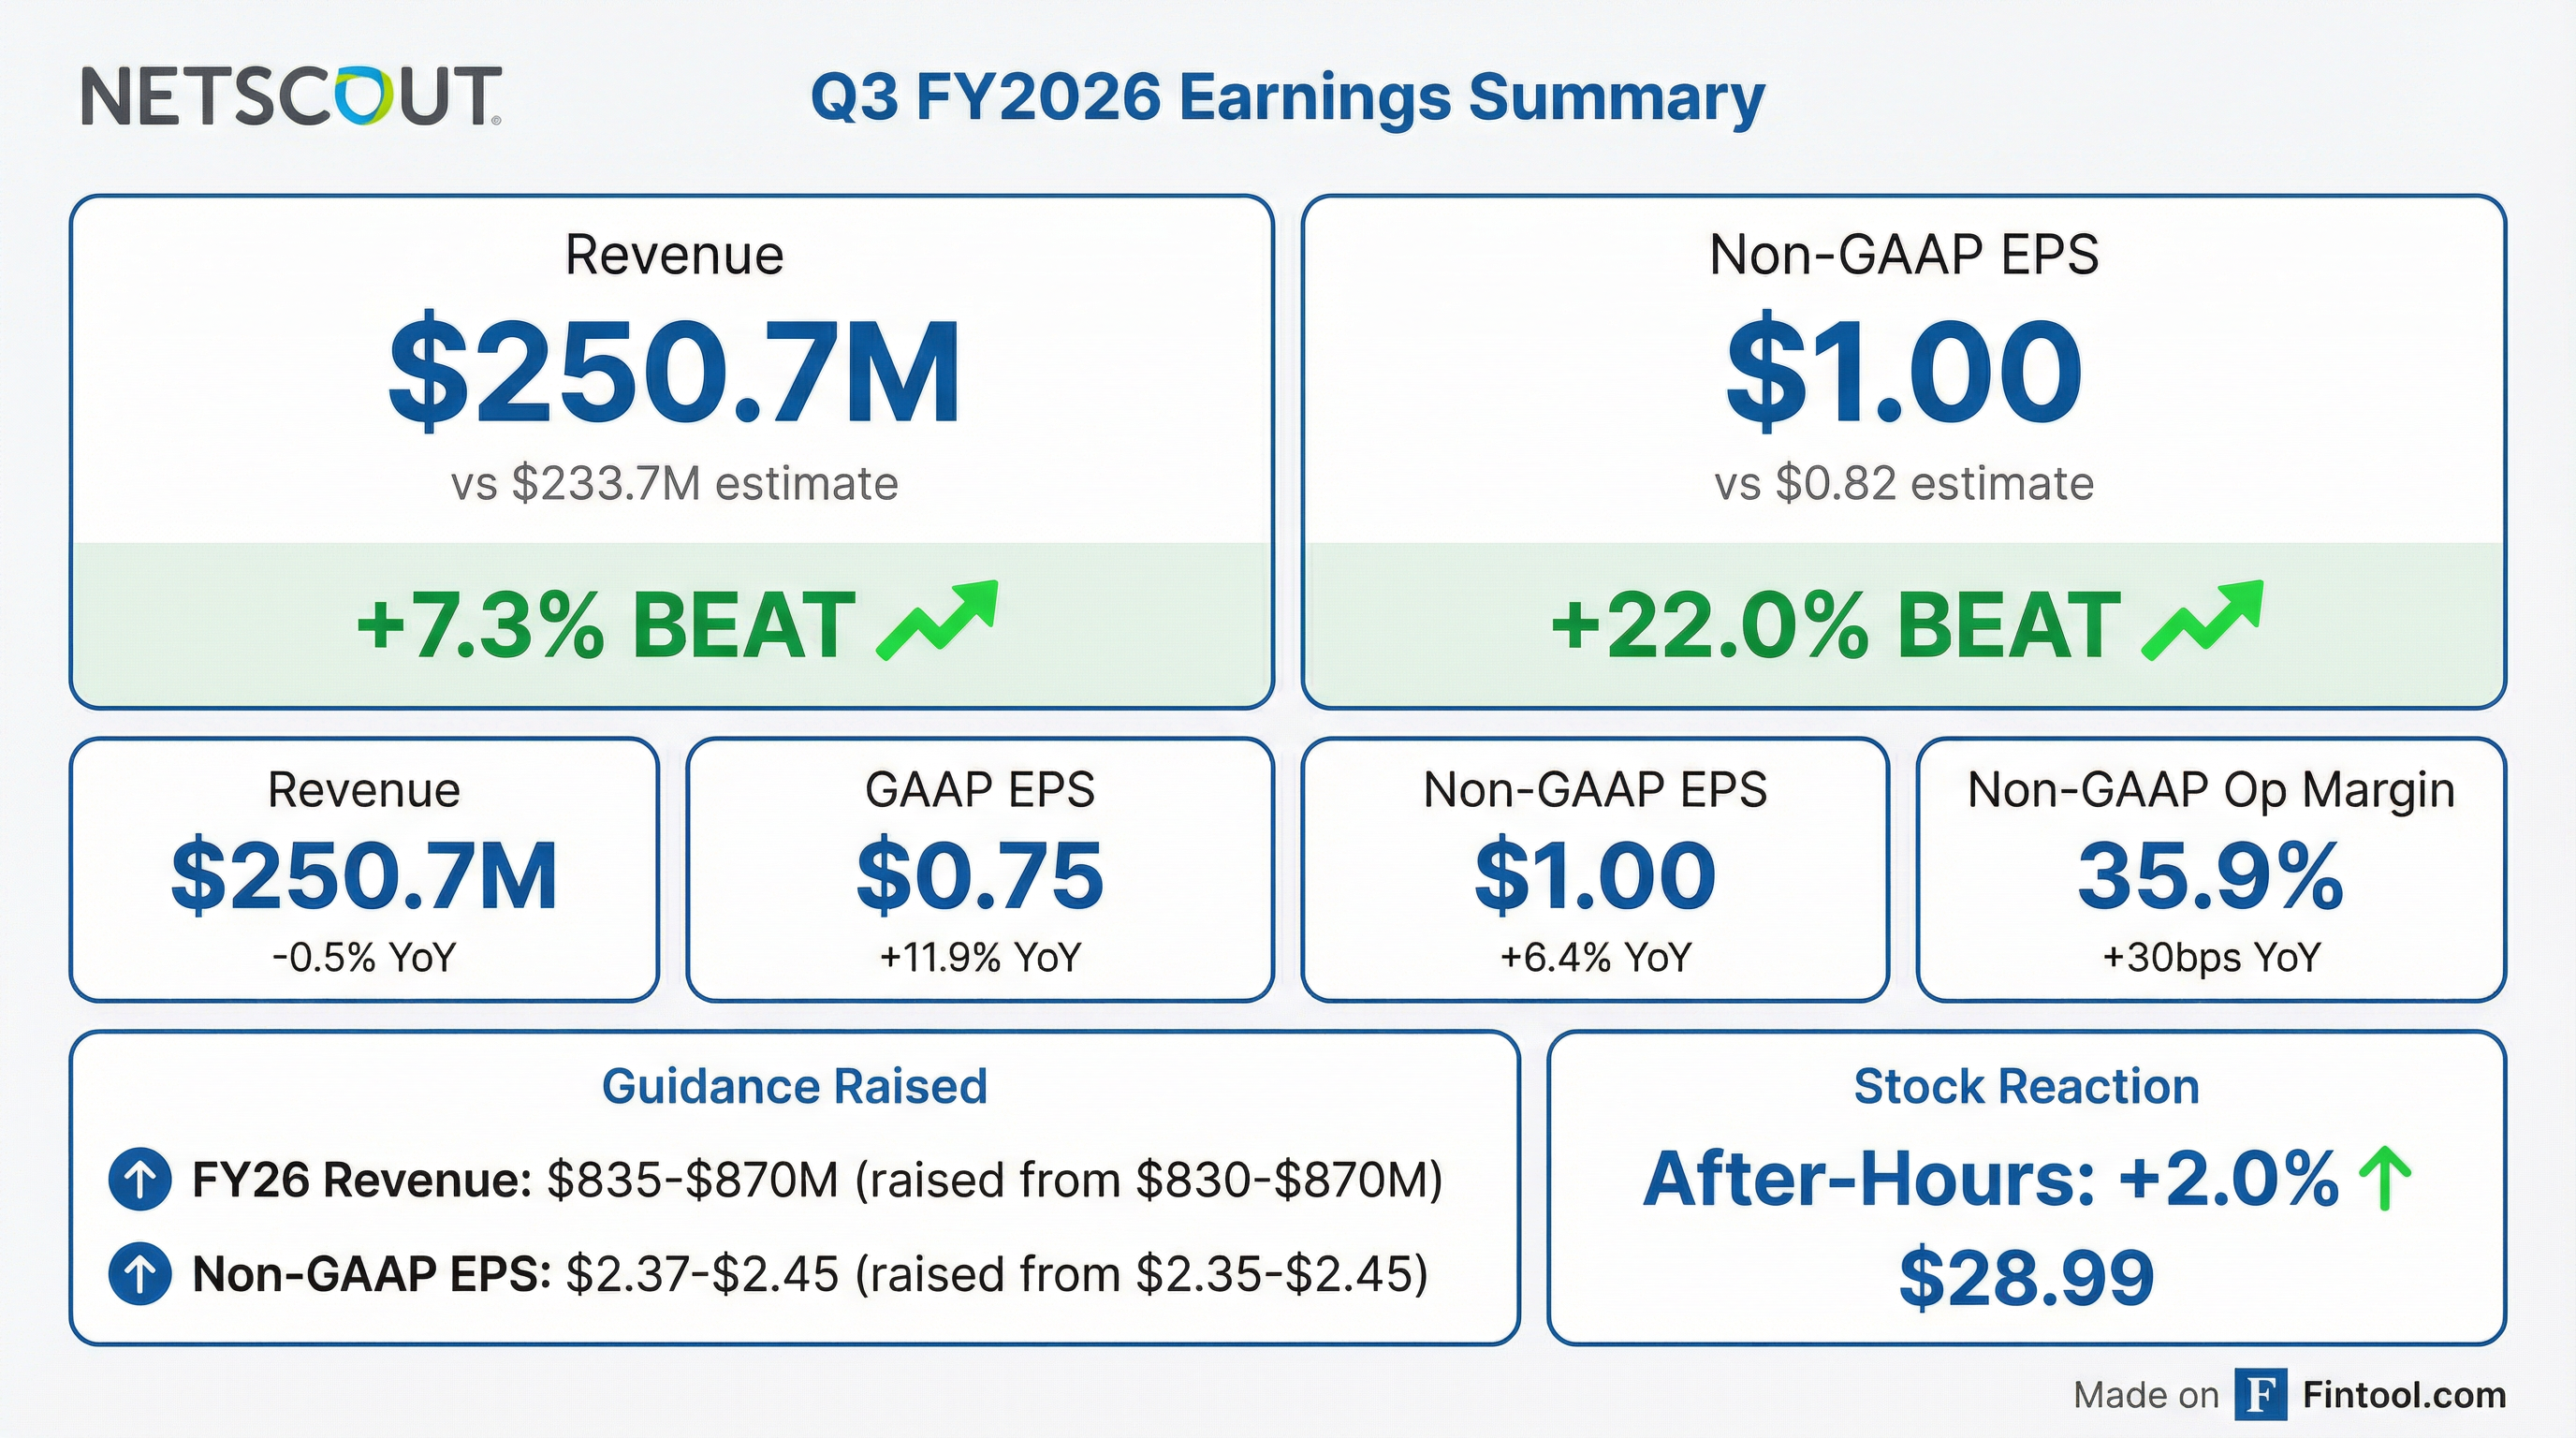
NETSCOUT Systems (NASDAQ: NTCT) delivered a strong Q3 FY2026, beating analyst expectations on both revenue and earnings while raising its full-year guidance. Revenue of $250.7 million exceeded consensus by 7.3%, and non-GAAP EPS of $1.00 beat estimates by 22%. CEO Anil Singhal attributed the outperformance to acceleration of customer orders as enterprises utilized calendar year-end budgets, combined with growth across both Cybersecurity and Service Assurance product lines.
Did NETSCOUT Beat Earnings?
NETSCOUT delivered a double beat in Q3 FY2026, exceeding Wall Street expectations on both top and bottom lines:
*Values retrieved from S&P Global
The revenue beat marks NETSCOUT's ninth consecutive quarter of beating estimates. Management noted that certain product orders and service renewals originally anticipated for Q4 were pulled forward as customers utilized their calendar year-end budgets.
Year-over-Year Comparison
While total revenue was roughly flat year-over-year (-0.5%), this comparison is against a strong Q3 FY25 that benefited from similar order acceleration dynamics. The shift in revenue mix toward higher-margin service revenue (51% of total, up from 49%) helped drive margin expansion.
What Did Management Guide?
NETSCOUT raised the midpoint of its FY2026 guidance, signaling confidence in continued momentum:
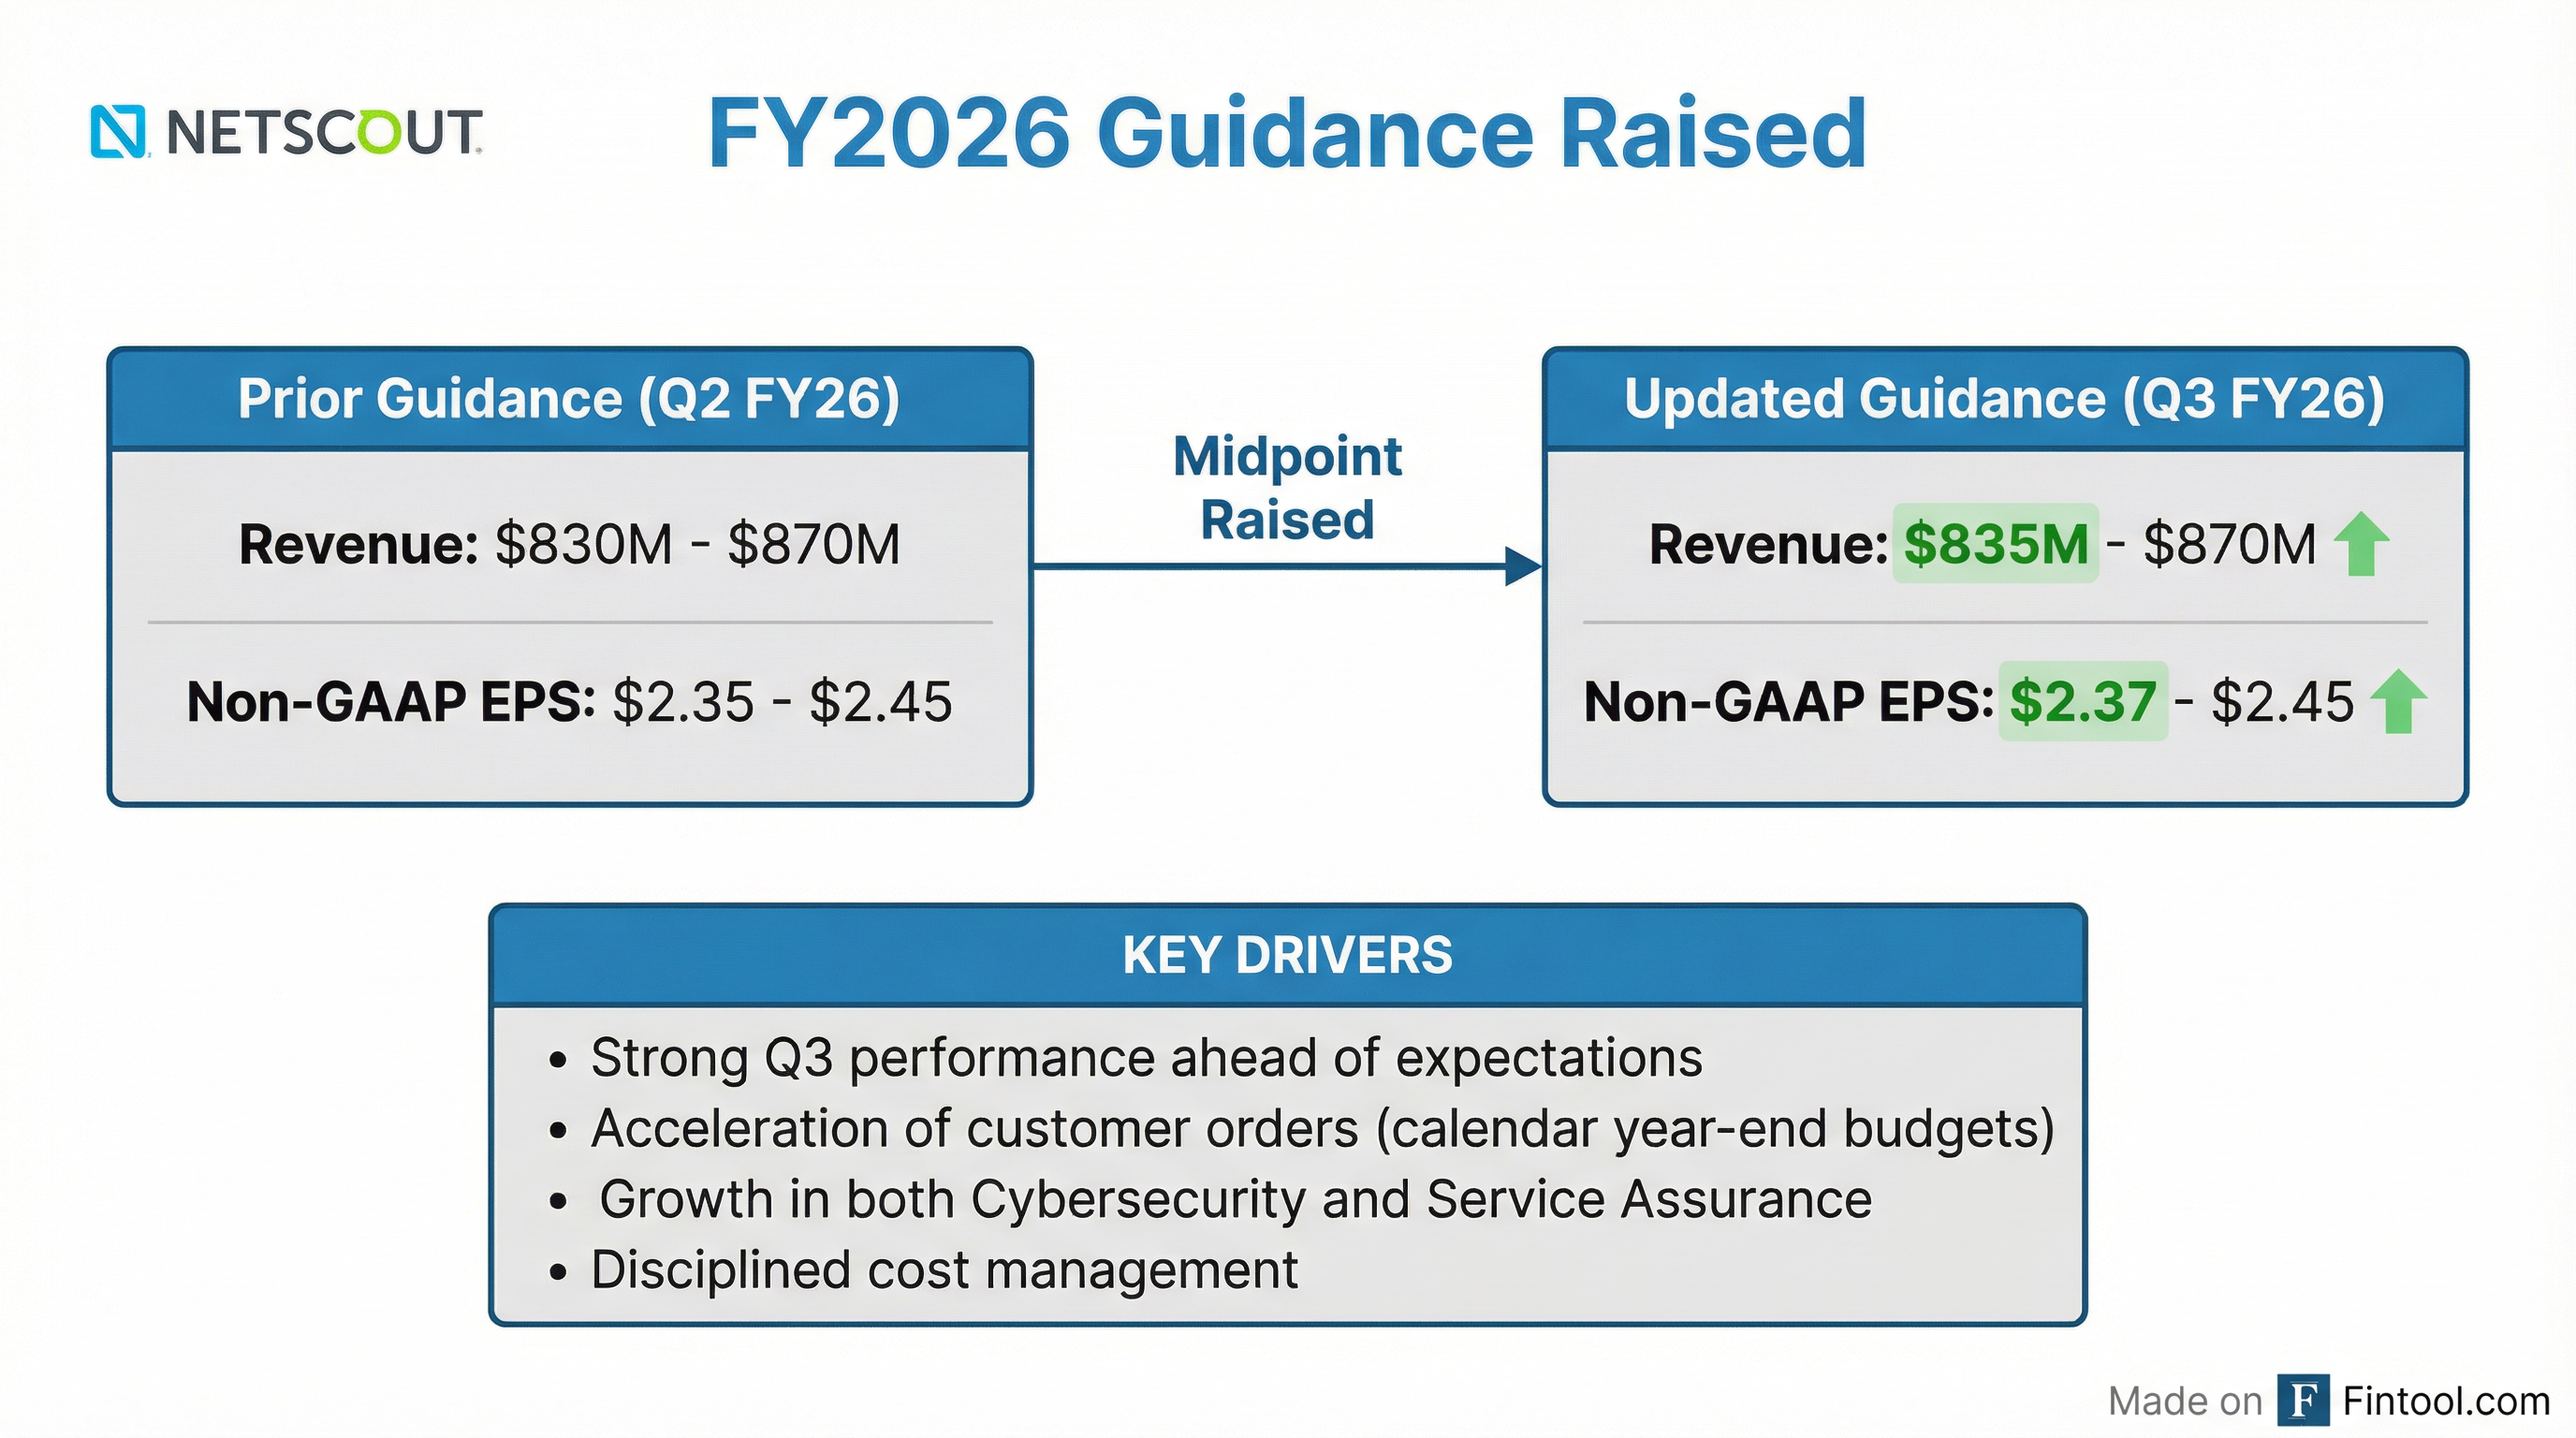
Source: NETSCOUT Q3 FY26 Earnings Slides
At the midpoint, the updated revenue guidance implies approximately 3.6% year-over-year growth for FY2026. Other FY26 assumptions include an anticipated tax rate of approximately 20% and 73-74 million weighted average diluted shares outstanding.
Q4 FY26 Implied Outlook
Based on YTD results and full-year guidance:
- 9M FY26 Revenue: $656.4M
- Q4 FY26 Implied Revenue: $178.6M - $213.6M (midpoint: $196.1M)
- Q4 FY25 Revenue: $205.0M
The implied Q4 outlook suggests a more conservative back half, which management attributed to the pull-forward of orders into Q3. This follows a similar pattern from Q3 FY25, when order acceleration from Q4 also created tougher sequential comparisons.
Revenue Segment Breakdown
The earnings slides provide detailed segment visibility on revenue composition:
By Product Line (YTD FY26)
Cybersecurity is growing nearly 2x the rate of Service Assurance, supporting the strategic shift toward security solutions.
By Customer Vertical (YTD FY26)
Enterprise customers are driving growth at 9.4% YoY, significantly outpacing the Service Provider segment (+2.2%). This trend aligns with enterprise IT modernization and security spending.
By Geography (YTD FY26)
International revenue is outpacing domestic growth (+12.2% vs +2.1%). Rest of World (+30.3%) is the standout, while Asia remains a soft spot (-3.2%).
What Changed From Last Quarter?
Several notable developments distinguished Q3 FY26 from Q2:
1. Order Acceleration Pattern Repeated
Similar to Q3 FY25, customers accelerated orders from Q4 to utilize calendar year-end budgets. CEO Singhal emphasized this contributed to the beat but creates a tougher Q4 comparison.
2. Service Revenue Outpacing Product Revenue
Service revenue grew 4.2% YoY to $129.0M (51% of total), while product revenue declined 5.1% to $121.7M (49% of total). This shift toward recurring revenue is a positive for earnings quality. In Q2 FY26, management had highlighted strong maintenance renewal timing.
3. Margin Expansion Continued
Non-GAAP operating margin expanded 30bps to 35.9%, driven by product mix and disciplined cost management. GAAP operating margin improved more dramatically to 25.7% from 24.5%, benefiting from the absence of prior-year restructuring charges.
4. Balance Sheet Strengthened
Cash, cash equivalents, and investments increased to $586.2M as of December 31, 2025. The company has no debt outstanding ($0 total long-term debt).
5. Free Cash Flow Quarterly Trend
Q2's low FCF was an aberration; Q3 returned to strong cash generation. The 9M FY26 FCF run rate ($135M) significantly exceeds FY25's $108M full-year FCF, reflecting improved profitability and working capital management
How Did the Stock React?
NTCT shares traded at $28.42 at the regular session close and rose to $28.99 in after-hours trading (+2.0%) following the earnings release.
Stock Performance Context
*Values retrieved from S&P Global
The stock has risen approximately 60% from its 52-week low, reflecting improved investor sentiment around the company's execution and margin trajectory. The positive after-hours reaction suggests the beat-and-raise was well-received, though the modest 2% move indicates some of the outperformance may have been anticipated.
Q&A Highlights
The Q&A session revealed several key insights not covered in prepared remarks:
Order Pull-In Quantification
CFO Tony Piazza quantified the pull-forward impact at approximately $15 million, comprising both product revenue and service revenue. Management noted the Q4 guide does not assume significant additional pull-ins.
AI Revenue Disclosure
When asked about the AI contribution, CEO Singhal provided the first quantification: AI-related revenue totaled approximately $15 million for the first nine months of FY26. He described two use cases: (1) traditional service triage via NETSCOUT's own applications, and (2) new use cases where "Smart Data" feeds third-party platforms like Splunk or future Agentic AI systems.
Service Provider Outlook
CEO Singhal acknowledged ongoing challenges in the service provider segment:
"There have been big layoffs at some of the many companies. And despite some of the monetization opportunity of 5G slicing, there's constant pressure, certainly in the service assurance area. But we are hoping there'll be less pressure even for these people in the cybersecurity and AI area... We think that service assurance portion of ServiceVITAL will continue to be challenging next year also. But it'll be more than made up by a good or better environment in DDoS."
Supply Chain and Tariff Impact
Management clarified that tariff/supply chain risks primarily affect timing, not margins:
"Since we are not shipping the hardware, the increased cost for the servers, which they use to run our software, doesn't really impact our margins. It impacts the timing... Lead times of the hardware they buy directly from the server vendors like Dell and all those, those are really impacted, and they might impact timing of software order also."
CFO Piazza added: "The majority of our revenue is in services and software... the direct material cost isn't that significant."
Key Business Highlights
Cybersecurity Momentum
Management continues to emphasize the DDoS protection market opportunity:
- Won Frost & Sullivan's 2025 Global Company of the Year in network monitoring
- Omnis Cyber Intelligence with Omnis CyberStream won Security Today's 2025 CyberSecured Award
- Adaptive DDoS subscription product gaining traction
Service Assurance Innovation
New product capabilities announced:
- Enhanced nGeniusONE with real-time deep packet inspection over Ethernet and Wi-Fi 7
- New nGenius Edge Sensors for remote site monitoring
- 5G Standalone network slice observability for CSPs
- SSL/TLS certificate monitoring enhancements
AI Integration Theme
Consistent with Q2 commentary, management emphasized the "AI-ready data platform" positioning. In Q2, CEO Singhal described NETSCOUT as a "smart data company" now sharing telemetry with third-party platforms like Splunk and ServiceNow.
Nine-Month FY26 Performance
The YTD results highlight NETSCOUT's turnaround from FY25's goodwill impairment:
The 9M FY25 period included a $427M goodwill impairment charge and $19.9M in restructuring charges, making year-over-year GAAP comparisons less meaningful.
Risks and Considerations
Order Timing Volatility
The recurring pattern of Q3 order acceleration from Q4 creates lumpy quarterly comparisons. Management acknowledged this in their guidance commentary.
Revenue Concentration
One customer represented more than 10% of Q2 revenue (related to federal government). Large deal dependency can create volatility.
Product Revenue Pressure
Product revenue declined 5.1% YoY in Q3, offset by service revenue growth. The long-term trend toward software and subscription models is positive, but product weakness bears monitoring.
Macro Sensitivity
In Q2, management highlighted monitoring the "uncertain macro environment," government shutdown risk, and potential tariff impacts.
What to Watch for in Q4 FY26
- Sequential Revenue Decline: Guidance implies Q4 revenue of ~$196M at midpoint vs. Q3's $250.7M, as order timing normalizes
- Federal Government Pipeline: Q2 benefited from federal acceleration; watch for continued momentum
- Subscription Mix: Adaptive DDoS and other subscription products are strategic priorities
- Margin Sustainability: Can 35%+ non-GAAP operating margins persist with lower Q4 revenue?
Summary
NETSCOUT delivered a strong Q3 FY2026 with a 7.3% revenue beat and 22% EPS beat, driven by order acceleration and continued strength in both Cybersecurity and Service Assurance. The guidance raise, while modest (+$2.5M revenue midpoint), signals management confidence in achieving return to annual revenue growth. Key positives include margin expansion, balance sheet strength ($586M cash, no debt), and AI/cybersecurity product innovation. The main watch item remains order timing volatility, with Q4 implied to be softer sequentially as calendar year-end dynamics normalize.
Earnings call scheduled for 8:30 AM ET on February 5, 2026. Transcript will be available on the NTCT documents page.
Related Links: